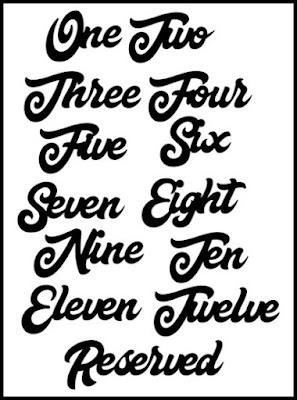
My wife reminded me that peak wedding season is starting here in the U.S. This pattern is simple but useful for those who have seating assignments at wedding receptions.
In the simulated image above I am showing the word numbers painted metallic gold.
Wedding Facts:
Every year an average of 2.4 million weddings are performed in the U.S. (approx. 150,000 per year in Canada).
Today’s median age for first-time brides is 25 years. For grooms, it’s 27 years.
Second marriage median age is brides 35 years, grooms 38 years.
The average amount spent on a traditional American wedding is $22,000.
67% of women continue to wear the same fragrance they wore on their wedding day.
The number 1 wedding city in the U.S. (and number 2 in the world) is Las Vegas with an average of 114,000 weddings per year (the number 1 in the world is Istanbul, Turkey with 166,000).
The number 2 wedding city in the U.S. is Gatlinburg, TN with 42,000 weddings.
The number 3 wedding city in the U.S. is New Orleans, LA with an average of 36,000 marriages.
Source: Association for Wedding Professionals Int’l <http://afwpi.com/wedstats.html>
Marriages by the month:
June is the most popular month for weddings, followed by August, May, September, and October.
January 4.7%
February 7.0%
March 6.1%
April 7.4%
May 9.8%
June 10.8%
July 9.7%
August 10.2%
September 9.6%
October 9.4%
November 7.4%
December 7.8%
Check out all the wedding supplies that are available on Amazon. This is my affiliate link and a great way to help support my blog. Thank you for your support.
An Old but Useful Tip:
As scroll saw users we cut a lot of small parts that need to be glued together. Many times clamping is a challenge. You carefully glue and line up the parts. When you try to install a clamp the pieces slid around and lose alignment. If you don't notice this movement it can be a challenge to fix after the glue cures.
This trick has been around for years but if you are new to woodworking you may have not run across it yet. Salt can be a huge help. Apply the glue and spread it around. Shake just a few flakes of salt in the glue. Don't over-salt the board. Just a very few flakes. Now when you press the parts together the salt will grip the face of each board and help hold it in place.
Click to Enlarge
$12 per sheet of 12 coins plus $3.50 shipping
Inlay with a 1" Forstner Bit.
The perfect way to sign your work.

Email Newsletter Readers: Remember that the Newsletter is just a copy of the daily blog post. To see the post in its proper formatting click this link. If you ever misplace a pattern or any item you see here you can always find it on the blog. Everything stays on the blog forever.
Every Scrollsaw Workshop Pattern from 2007-2021 on DVD, USB drive, or Instant Download. Over 3,600 Patterns!
Purchase the entire Scrollsaw Workshop pattern catalog for offline access.You will never run out of fun patterns to cut.
Three delivery options.
After payment, you will receive an email with the download link. This is a large file. You should not attempt to download it on a tablet or smartphone. It is a compressed file that will need to be extracted to your hard drive. Basic computer skill are necessary to extract the file.
The USB drive will be shipped to the US only first-class mail. Shipping time varies but you will get a tracking number. I normally ship within three days. USPS shipping normally varies from three days to a week.
The DVD is manufactured and shipped by my distributor. They ship to several countries but not all. Check their shipping list to see if your country is supported.
Here is a quick video showing you what you will get when you purchase the offline Scrollsaw Workshop Catalog
My two "Wooden Vases on the Scroll Saw" books make it easy.
The books are $12 each and available for instant download after purchase. Click for Video Demonstration.
My Sponsors:
Support the businesses that support our community.
Home of Pegas scroll saw blades.


